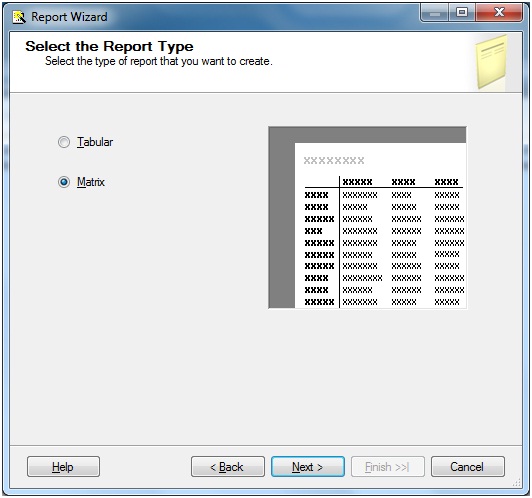
Step 1:Let us choose Matrix as the report type and click on Next button.
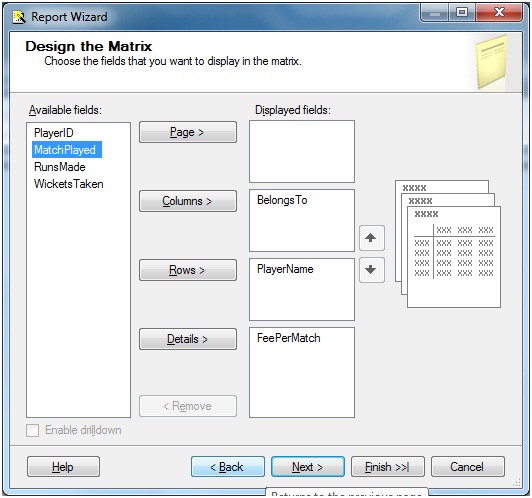
And that brings up Design the Table Screen. Suppose we want to see, players belonging to which country is taking how much match fee. Basically, we want to see the BelongsTo field in the Report Column/Header, the PlayerName field in the rows and the FeePerMatch field in the Details section
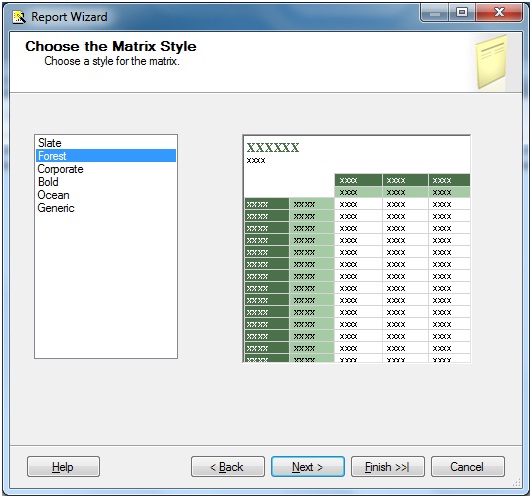
Clicking on Next button will display Choose the Table Style Screen from where we can choose the various table styles. We will choose Forest here
Click on the Next button brings up the final screen where we will specify a suitable name to our report.

Click Finish.
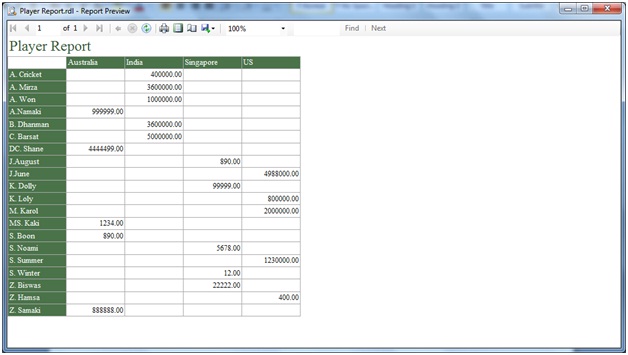
Step 2:Run the report or click on the preview button and the result is as under

No comments:
Post a Comment