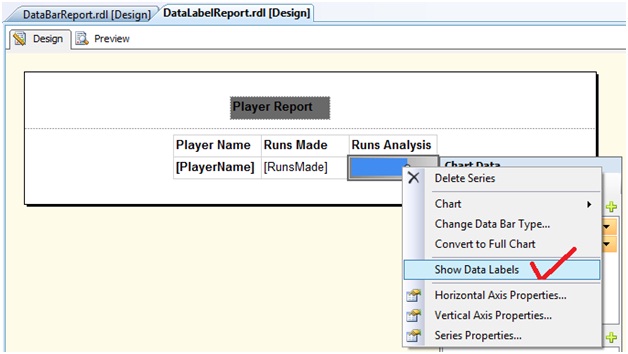
Right click the Data Bar and choose Show Data Labels.
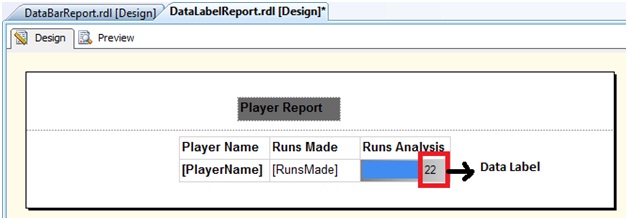
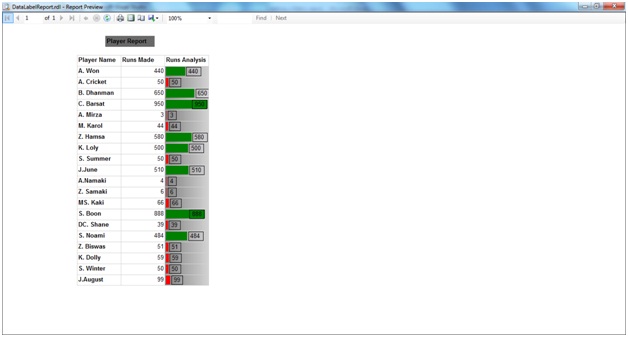
The Data Label appears as shown below
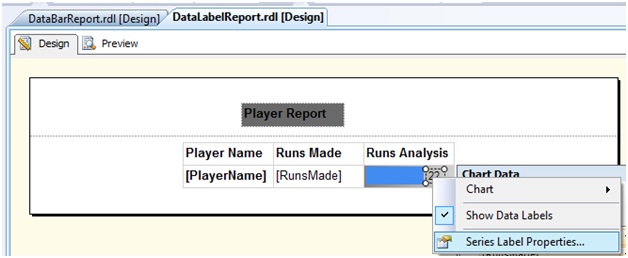
Right click on the data label and choose the Series Label Properties
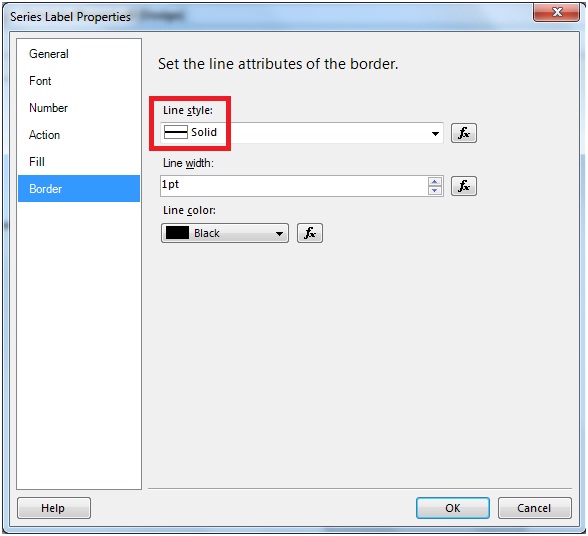
In the Series Label Properties window, go to the Border tab and set the Line Style to Solid.
Run the report. As can be figured out that, we now have the Data Bar and the Data Label together.

No comments:
Post a Comment